Community through digital connectivity? Communication infrastructure in multicultural London
This project, supported by an LSE Seed grant, examines the role that communication plays in promoting and hindering community among London’s diverse populations in the diverse area of Harringay in North London. Our experimentation with community asset mapping and communication asset mapping methods has proved both inspiring and challenging. Our attempt to think across community assets and communication assets aims to address some of the gaps in existing work on community asset mapping. While symbolic and structural resources such as education, local institutions and property have been systematically studied as community-building resources, communication infrastructures are little studied and their potential as community assets largely unrecognised. Our London-based project is a collaborative trans-urban initiative with explores communication infrastructure in two multicultural areas of the two global cities – London and Los Angeles (in collaboration with Metamorphosis, University of Southern California).
What we have aimed to develop in our ongoing project is a mapping of communication infrastructure and the different ways in which local residents in Harringay use media and communications as assets – especially in developing temporal and sustained networks, associations and coalitions which advance their engagement with local life. While not exclusively, we are particularly interested in the ways in which local residents might link to others in the area and beyond (in sustained or ephemeral ways) in their effort to advance access to and knowledge associated to education and schooling. We are interested in exploring how much those networks are defined (i) within ethnic lines and/or across ethnic lines; (ii) within local and/or across translocal and transnational spaces; (iii) within mediated and/or interpersonal communication systems.
In developing our understanding of communication assets, we have adopted a triangular framework that critically engages with three lines of research and methods on asset mapping.
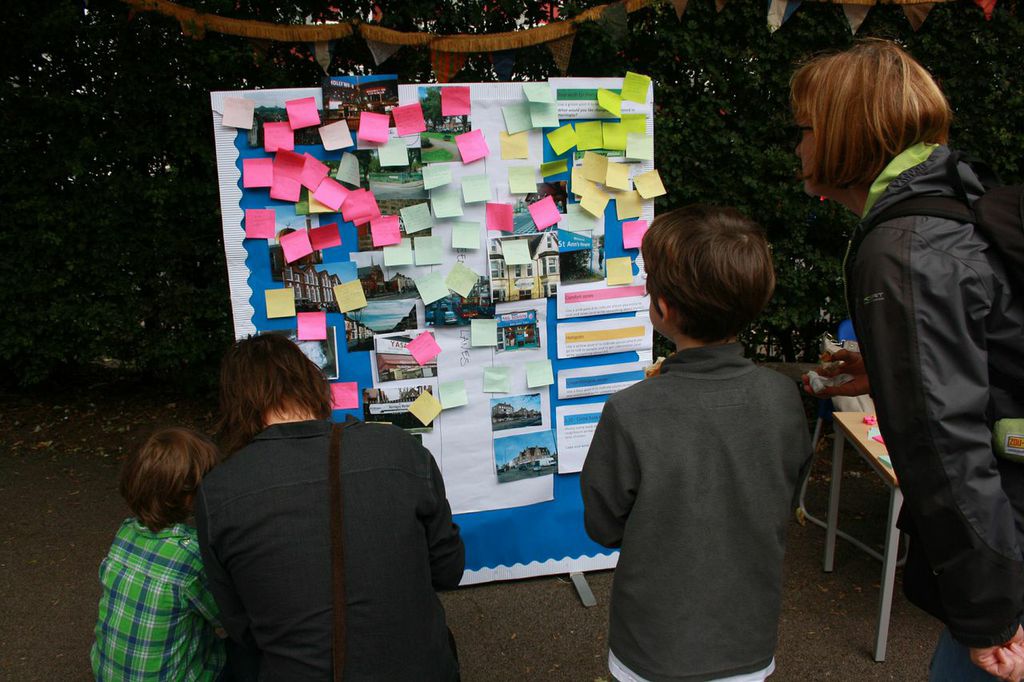
School public engagement event
- We started with Mathie and Cunningham’s (2002) ABCD definition based on which communities can advance project development if they can identify and mobilise assets they have in their locale. This approach emphasises the importance of storytelling and sharing in a community as a way to celebrate, recognise and advance successful and effective project development.
- We learned and adapted elements of the communication asset mapping approach as developed by our colleagues of the Metamorphosis project at the University of Southern California. Ball-Rokeach and Kim (2013) define communication assets as physical components of the urban environment that residents consider positive spaces of social and community interaction. These communication assets can take the form of hotspots – where residents gather to talk – and comfort zones – community institutions and locations that residents feel most connected to.
- In our knowledge exchange and collaboration with Giota Alevizou within the AHRC-funded ‘Co-Designing Asset Mapping: Comparative Approaches’ we have engaged in conceptual and methodological exchanges of mapping community assets that are both local/tangible and digital.
Our engagement with these different approaches has brought forward a number of critical questions about the strengths and weaknesses of asset mapping approaches when studying communication infrastructure and community. Our engagement with asset mapping also inspired us in experimenting with innovative methodological approaches during fieldwork.
Mapping strengths of asset mapping approaches in the study of communication infrastructure
Asset mapping approaches enabled us to record the range of resources that locals recognise and mobilise (or feel they can mobilise) in developing networks of communication and action. More particularly, we used two asset mapping exercises during focus groups and a public engagement event.
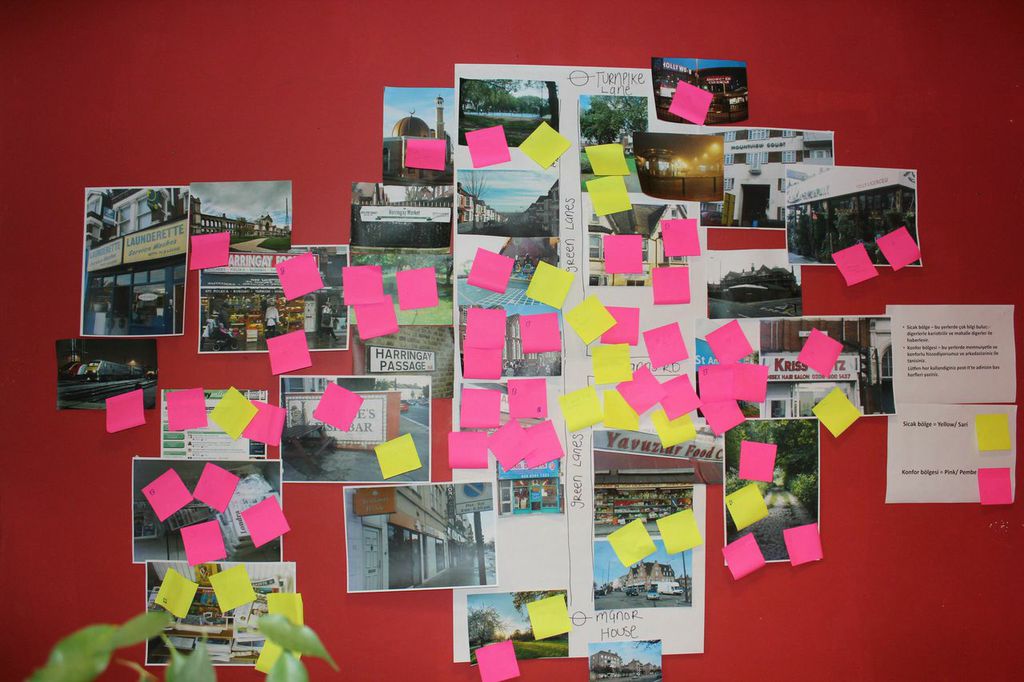
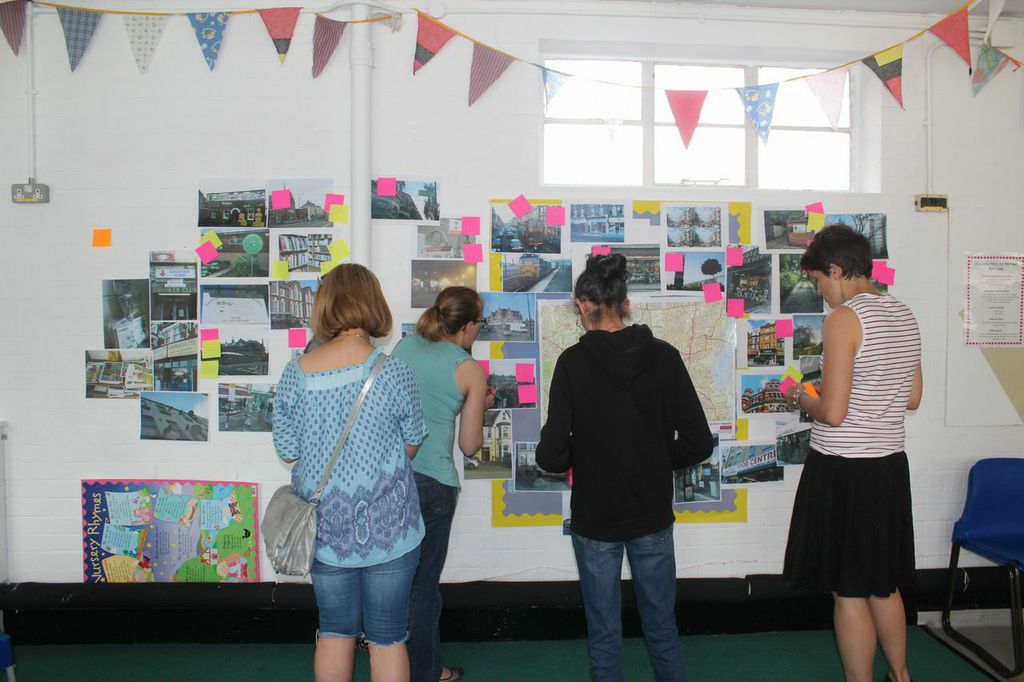
- The first exercise adapted the Metamorphosis approach of hotspots and comfort zones. Participants in each local residents’ focus group and those attending a school summer fair were invited to recognise hotspots, comfort zones and no-go areas. For the exercise, we developed a board with visuals associated with the locale: the high street was drawn in the middle and pictures of various local places (schools, shops, restaurants, parks) where positioned around the high street, representing their physical geography. We also added digital and intangible meeting places and sources of information, such as a hyperlocal online forum and newspapers on the board and also asked participants to add any places/media we didn’t include. Participants were given colour-coded post-its each corresponding to hotspots (places where they go to get information and communicate with others); comfort zones (places where they go to seek comfort); no-go areas (paces where they rather not go). The findings are rich and we are currently in the process of analysis. The main strengths of this exercise are two: (i) We can observe how locals’ ‘post-it footprint’ reveals patterns in local asset recognition. This happens in an interactive way where participants can talk through their choices and also make notes on their post-its. Our next aim is to analyse their responses in a systematic thematic framework that can reveal the map of different assets in the area; (ii) By counter-posing assets and undesired places we can also observe tensions associated with local life, allowing participants to both recognise what they see as assets and also as weaknesses/limitations.
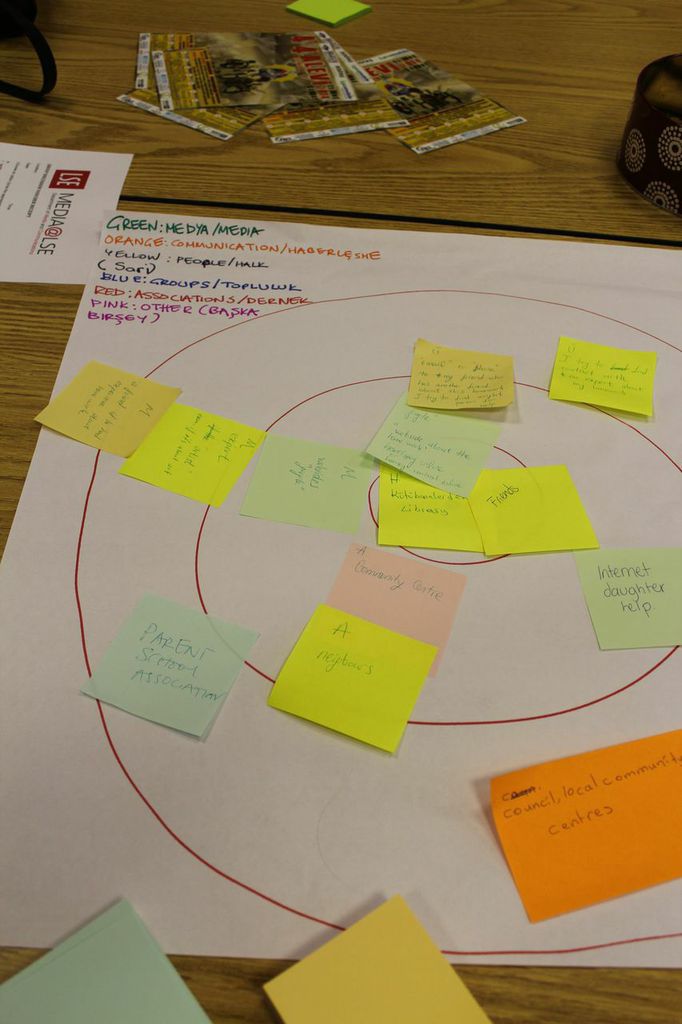
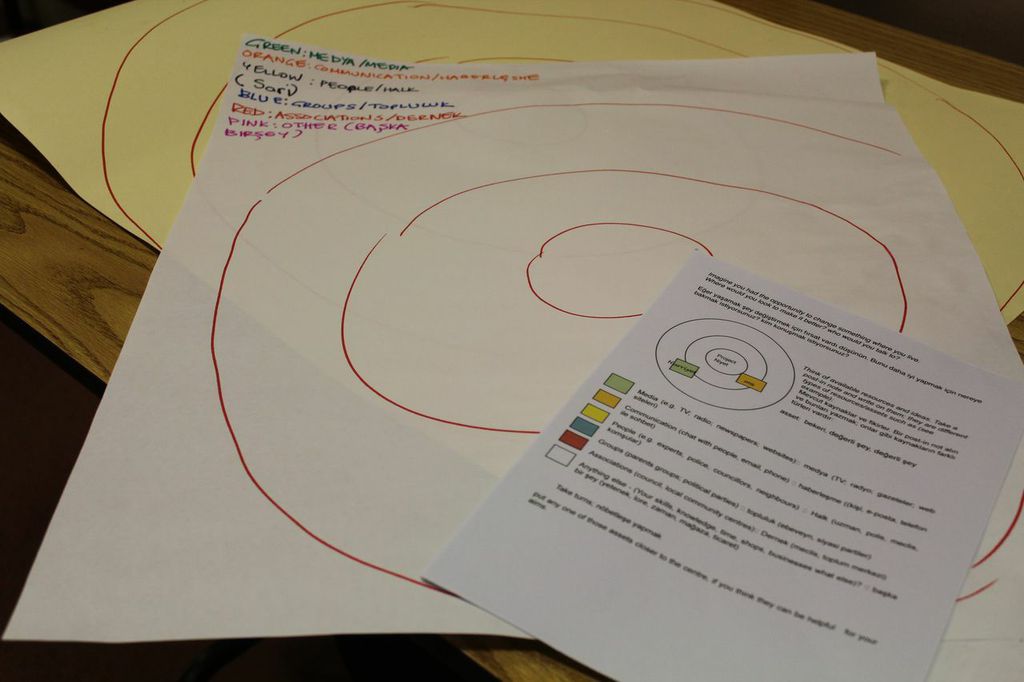
- The second asset mapping exercise was inspired by the Creative Citizens’ approach in Tottenham (see for example the post on Creative Place-making) and was further developed through discussions and knowledge exchange with Giota Alevizou. This exercise was an integral part of the focus groups conducted with men and women belonging to the three main ethnic groups in our area of study. Participants in the focus groups were asked towards the end of the discussion to work towards a commonly recognised local project (we picked up a topic that emerged as important during the conversation – e.g. Food festival; parking control). They were offered post-its and props representing people, media, communication infrastructure, groups and associations and were asked to position any of those in a concentric circle, closer or further away from the central common goal (e.g. to organise the Food Festival). They were asked to do so while being invited to work together within the focus group (e.g. prompted to imagine they are in the organising committee). This exercise brought out some interesting findings in regards to what kind of people are assets the participants would mobilise – and not less importantly – which they would not mobilise. We anticipate that the findings of this exercise will be integrated in a thematic analysis alongside the other focus group material.
Some challenges and limitations
There is no doubt that the asset mapping methods allow us to collect fascinating data which we would probably need much longer to generate if we didn’t use the techniques above. However, and in conclusion, I would also like to raise some questions about the challenges associated with these methods:
- Physical Vs digital? Community asset mapping tends to focus on localities and physical assets. What are the limitations and the potentials of recording assets in a meaningful way beyond physicality and contained locality?
- Communication/community assets and socio-economic context: a relation of co-constitution or an antagonistic opposition? How much does a communication/community asset approach allow researchers to record and take into account structural and symbolic inequalities in a meaningful way?
- Analysis, what analysis? What frameworks, tools and techniques of analysis do we employ to make sense of the fascinating data emerging out of asset mapping exercises? Do we subject asset mapping findings to existing analytical frameworks and techniques (e.g. thematic analysis of focus group data) or do we adopt different and distinct analytical paths?


